Blazor Line Chart
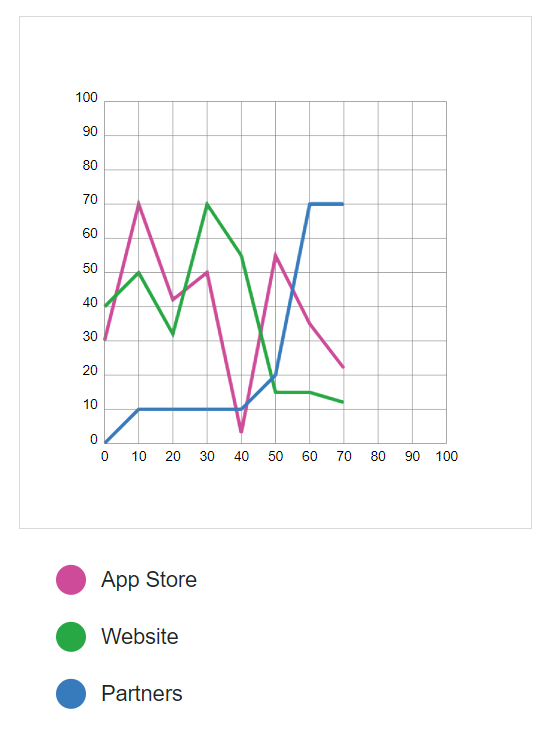
Usage
<LineChart InputData="[30,70,42,50,3,55,35,22 ],[40,50,32,70,55,15,15,12],[0,10,10,10,10,20,70,70]" InputLabels="App Store,Website,Partners"> </LineChart>
Please see WebAssemblyMan Blazor Charts project on how to include this donut chart in your Blazor project.
Source Code
- GitHub - Blazor Donut Chart
      protected override void BuildRenderTree(RenderTreeBuilder builder)
      {
          var seq = 0;
          builder.OpenElement(seq, "figure");
          builder.AddAttribute(++seq, "class", "line-chart");
          builder.OpenElement(++seq, "div");
          builder.AddAttribute(++seq, "class", "main");

          System.Diagnostics.Debug.WriteLine("ID"+InputData);

          string[] inputDataArrX = InputData.Split(new char[] { '[', ']' }, StringSplitOptions.RemoveEmptyEntries);
          string[] inputLabelsArr = InputLabels.Split(new char[] { ',' }, StringSplitOptions.RemoveEmptyEntries);

          int numLines = 0;
          System.Diagnostics.Debug.WriteLine("Start");
          foreach (string inputLine in inputDataArrX)
          {
              if (inputLine.IndexOfAny(new char[] { '0', '1', '2', '3', '4', '5', '6', '7', '8', '9' }) >= 0)
              {
                  numLines++;
              }
          }
          System.Diagnostics.Debug.WriteLine("End");
          string[] inputDataArr = new string[numLines];
          int lineCounter = 0;
          foreach (string inputLine in inputDataArrX)
          {
              if (inputLine.IndexOfAny(new char[] { '0', '1', '2', '3', '4', '5', '6', '7', '8', '9' }) >= 0)
              {
                  inputDataArr[lineCounter++] = inputLine;
                  System.Diagnostics.Debug.WriteLine("IL:" + inputLine);
              }
          }

          string[] colors = { "#ce4b99", "#27A844", "#377bbc" };
          string[] labels = { "App Store", "Website", "Partners" };

          double boundHeight = 150.0;
          double boundWidth = 150.0;

          SVG svg = new SVG() { { "width", "100%" }, { "height", "100%" }, { "viewBox", "0 0 150 150" } };
          Rectangle rect = new Rectangle() { { "class", "background-rect" }};
          svg.AddItems(rect);


          int numHorizontalLines = 10;
          int numVerticalLines = 10;
          double verticalStartSpace = 25.0;
          double horizontalStartSpace = 25.0;
          double verticalEndSpace = 25.0;
          double horizontalEndSpace = 25.0;
          double gridYUnits = 10;
          double gridXUnits = 10;

          double verticalSpace = (boundHeight- verticalStartSpace-verticalEndSpace) / (numHorizontalLines);
          double horizontalSpace = (boundWidth - horizontalStartSpace-horizontalEndSpace) / (numVerticalLines);

          double totalGridWidth = ((double)(numVerticalLines-1)) * horizontalSpace;
          double totalGridHeight = ((double)(numHorizontalLines-1)) * verticalSpace;
          System.Diagnostics.Debug.WriteLine("TotalGridHeight:" + totalGridHeight+":"+ verticalSpace);

          //Horizontal Lines
          double y = verticalStartSpace;
          double startGridY = 0;
          for (int counter=0;counter<=numHorizontalLines;counter++)
          {

              Path path = new Path() { { "class", "horizontal-grid-lines" }, { "d", "M "+horizontalStartSpace.ToString()+" "+(boundHeight - y).ToString() + " L "+(boundWidth-horizontalEndSpace).ToString()+" "+(boundHeight - y).ToString() } };
              Text label = new Text() { { "class", "y-axis-labels" }, { "x", (horizontalStartSpace-2).ToString() }, { "y", (boundHeight - y).ToString() }, { "content", (startGridY).ToString() } };
              svg.AddItems(path,label);
              System.Diagnostics.Debug.WriteLine("Y:" + y);

              y = y + verticalSpace;
              startGridY = startGridY + gridYUnits;
          }

          //Chart Line
          double gridx=0, gridy = 0;
          gridx = horizontalStartSpace;
          gridy = boundHeight - verticalStartSpace;
          int colorcounter = 0;
          foreach (string iData in inputDataArr)
          {
              string chartLine = "";
              double gridValueX = 0;
              double gridValueY = 0;
              bool firstTime = true;

              string[] inputLineArr = iData.Split(',');
              int[] intAry=new int[inputLineArr.Length];
              for (int i = 0; i < inputLineArr.Length; i++)
                  intAry[i] = int.Parse(inputLineArr[i]);

              foreach (int i in intAry)
              {
                  if (firstTime)
                  {
                      chartLine = chartLine + "M ";
                      firstTime = false;
                      gridValueX = horizontalStartSpace;
                      gridValueY = verticalStartSpace;
                      double gridValue = ((double)i) * verticalSpace / gridYUnits;
                      gridValueY = boundHeight - (gridValueY + gridValue);
                      chartLine = chartLine + gridValueX.ToString() + " " + gridValueY.ToString();
                  }
                  else
                  {
                      chartLine = chartLine + " L ";
                      gridValueX = gridValueX + horizontalSpace;
                      gridValueY = verticalStartSpace;
                      double gridValue = ((double)i) * verticalSpace / gridYUnits;
                      gridValueY = boundHeight - (gridValueY + gridValue);
                      chartLine = chartLine + gridValueX.ToString() + " " + gridValueY.ToString();
                  }
              }
              Path linepath = new Path() { { "class", "line-"+(colorcounter+1).ToString() },{ "d", chartLine } };
              colorcounter++;
              svg.AddItems(linepath);

          }

          //Vertical Lines
          double x = horizontalStartSpace;
          double startGridX = 0;
          for (int counter = 0; counter <= numVerticalLines; counter++)
          {

              Path path = new Path() { { "class", "vertical-grid-lines" }, { "d", "M " + x.ToString() +" "+ (boundHeight-verticalStartSpace).ToString() + " L "+ x.ToString() + " " +(verticalEndSpace).ToString() } };
              Text label = new Text() { { "class", "x-axis-labels" }, {"x",x.ToString() }, { "y", (boundHeight - verticalStartSpace + 5).ToString() }, { "content", (startGridX).ToString() } };
              startGridX = startGridX + gridXUnits;

              svg.AddItems(path,label);
              x = x + horizontalSpace;
          }

          BlazorRenderer blazorRenderer = new BlazorRenderer();
          blazorRenderer.Draw(seq, builder, svg);

          builder.OpenElement(++seq, "figcaption");
          builder.AddAttribute(++seq, "class", "key");
          builder.OpenElement(++seq, "ul");
          builder.AddAttribute(++seq, "class", "key-list");

          colorcounter = 0;
          foreach (string iData in inputDataArr)
          {
              builder.OpenElement(++seq, "li");
              builder.OpenElement(++seq, "span");
              builder.AddAttribute(++seq, "class", "legend-"+(colorcounter+1).ToString());

              builder.CloseElement();

              string label="";
              if (colorcounter<inputLabelsArr.Length)
                  label=inputLabelsArr[colorcounter];

              builder.AddContent(++seq, label);
              builder.CloseElement();
              colorcounter++;
          }

          builder.CloseElement();
          builder.CloseElement();


          builder.CloseElement();
          builder.CloseElement();
      }
The CSS Style Sheet values used by the SVG line chart.
          .line-chart{
          }

              .line-chart div {
                  background:white;
                  border: white;
                  border-style: solid;
                  border-width: 1px;
              }

              .line-chart div svg{
              }

              .line-chart div svg .background-rect{
                  width:100%;
                  height:100%;
                  fill:white;
                  stroke:lightgray;
                  stroke-width:0.5;
              }

              .line-chart div svg .horizontal-grid-lines{
                  fill:none;
                  stroke:gray;
                  stroke-width:0.2;
              }

              .line-chart div svg .y-axis-labels{
                  font-size:4px;
                  text-anchor:end;
              }

              .line-chart div svg .vertical-grid-lines{
                  fill:none;
                  stroke:gray;
                  stroke-width:0.2;
              }

              .line-chart div svg .x-axis-labels{
                  font-size:4px;
                  text-anchor:middle;
              }

              .line-chart div svg .line-1{
                  fill:none;
                  stroke:#ce4b99;
                  stroke-width: 1.0;
              }
              .line-chart div svg .line-2{
                  fill:none;
                  stroke:#27A844;
                  stroke-width: 1.0;
              }
              .line-chart div svg .line-3{
                  fill:none;
                  stroke:#377bbc;
                  stroke-width: 1.0;
              }
              .line-chart div svg .line-4{
                  fill:none;
                  stroke:#fe2712;
                  stroke-width: 1.0;
              }
              .line-chart div svg .line-5{
                  fill:none;
                  stroke:#fc600a;
                  stroke-width: 1.0;
              }
              .line-chart div svg .line-6{
                  fill:none;
                  stroke:#fb9902;
                  stroke-width: 1.0;
              }
              .line-chart div svg .line-7{
                  fill:none;
                  stroke:#fccc1a;
                  stroke-width: 1.0;
              }
              .line-chart div svg .line-8{
                  fill:none;
                  stroke:#fefe33;
                  stroke-width: 1.0;
              }
              .line-chart div svg .line-9{
                  fill:none;
                  stroke:#b2d732;
                  stroke-width: 1.0;
              }
              .line-chart div svg .line-10{
                  fill:none;
                  stroke:#66b032;
                  stroke-width: 1.0;
              }
              .line-chart div .key{
                  margin: 20px;
              }

              .line-chart div .key [class*="legend-"] {
                  margin: 5px;
                  margin-right: 10px;
                  display: inline-block;
                  vertical-align: middle;
                  width: 20px;
                  height: 20px;
                  /*
                  width: 26px;
                  height: 26px;
                  */
                  border-radius: 50%;
              }

              .line-chart div figcaption .key-list {
                  margin: 0;
                  padding: 0;
                  list-style: none;
                  font-size: 0.9em;
              }

              .line-chart div figcaption .key-list li {
                  margin: 0 0 8px;
                  padding: 0;

              }

              .line-chart div figcaption ul .legend-1 {
                  background:#ce4b99;
                  transform: translateY(-0.1em);
              }
              .line-chart div figcaption ul .legend-2 {
                  background:#27A844;
                  transform: translateY(-0.1em);
              }
              .line-chart div figcaption ul .legend-3 {
                  background:#377bbc;
                  transform: translateY(-0.1em);
              }
              .line-chart div figcaption ul .legend-4 {
                  background:#fe2712;
                  transform: translateY(-0.1em);
              }
              .line-chart div figcaption ul .legend-5 {
                  background:#fc600a;
                  transform: translateY(-0.1em);
              }
              .line-chart div figcaption ul .legend-6 {
                  background:#fb9902;
                  transform: translateY(-0.1em);
              }
              .line-chart div figcaption ul .legend-7 {
                  background:#fccc1a;
                  transform: translateY(-0.1em);
              }
              .line-chart div figcaption ul .legend-8 {
                  background:#fefe33;
                  transform: translateY(-0.1em);
              }
              .line-chart div figcaption ul .legend-9 {
                  background:#b2d732;
                  transform: translateY(-0.1em);
              }
              .line-chart div figcaption ul .legend-10 {
                  background:#66b032;
                  transform: translateY(-0.1em);
              }
WebAssembly
Blazor Topics
- Blazor Hello World
- Blazor Components
- Blazor Dashboard
- Blazor Charts
- Blazor Donut Chart
- Blazor Pie Chart
- Blazor Bar Chart
- Blazor Line Chart
- Blazor Data Binding
- Blazor Events
- Blazor Cascading Values & Parameters
- Blazor BuildRenderTree
- Injection (coming soon)
- Layout (coming soon)